The trading journal that reveals what your instincts can't see.
Not because they're bad traders. Because they can't see the pattern.
SOUND FAMILIAR?
I keep losing money. I just don't know why.
Hundreds of trades. Zero pattern visibility. The answer exists in your data — you just can't read it without the right lens.
→ Another month burning capital while the pattern repeats.
My Excel journal takes 40 minutes and reveals nothing.
Every hour on spreadsheets is an hour not spent studying your actual patterns. You're doing admin instead of improving.
→ Your edge erodes every session you can't track properly.
My win rate is 65% but my account is shrinking.
Win rate without R-multiples and expectancy is nearly meaningless. You might be taking 0.5R winners and 3R losers without knowing it.
→ You'll keep repeating the same structural mistake.
I revenge trade — and only realize it after the damage.
Behavioral patterns repeat invisibly until they're catastrophic. They only become visible in aggregate data across hundreds of trades.
→ One emotional session can erase a month of careful work.
01
Log any trade in under 30 seconds. Import from MT5, cTrader, or any broker CSV in one click.
| DATE | INSTRUMENT | SIDE | ENTRY | EXIT | NET P&L | R |
|---|---|---|---|---|---|---|
| Jun 1 | US100 | LONG | 19,420 | 21,345 | +$1,925.38 | 2.4R |
| May 29 | US100 | SHORT | 19,680 | 19,580 | +$10.03 | 0.2R |
| May 29 | EURUSD | LONG | 1.0854 | 1.0821 | −$3.43 | −0.1R |
| Apr 2 | US100 | LONG | 18,320 | 19,126 | +$806.82 | 1.8R |
| Mar 31 | US100 | SHORT | 19,820 | 20,470 | −$650.43 | −1.3R |
| Jun 1 | US100 | SHORT | 19,550 | 19,595 | −$5.09 | −0.1R |
| Jun 1 | XAUUSD | LONG | 2,318.4 | 2,321.0 | +$15.31 | 0.3R |
02
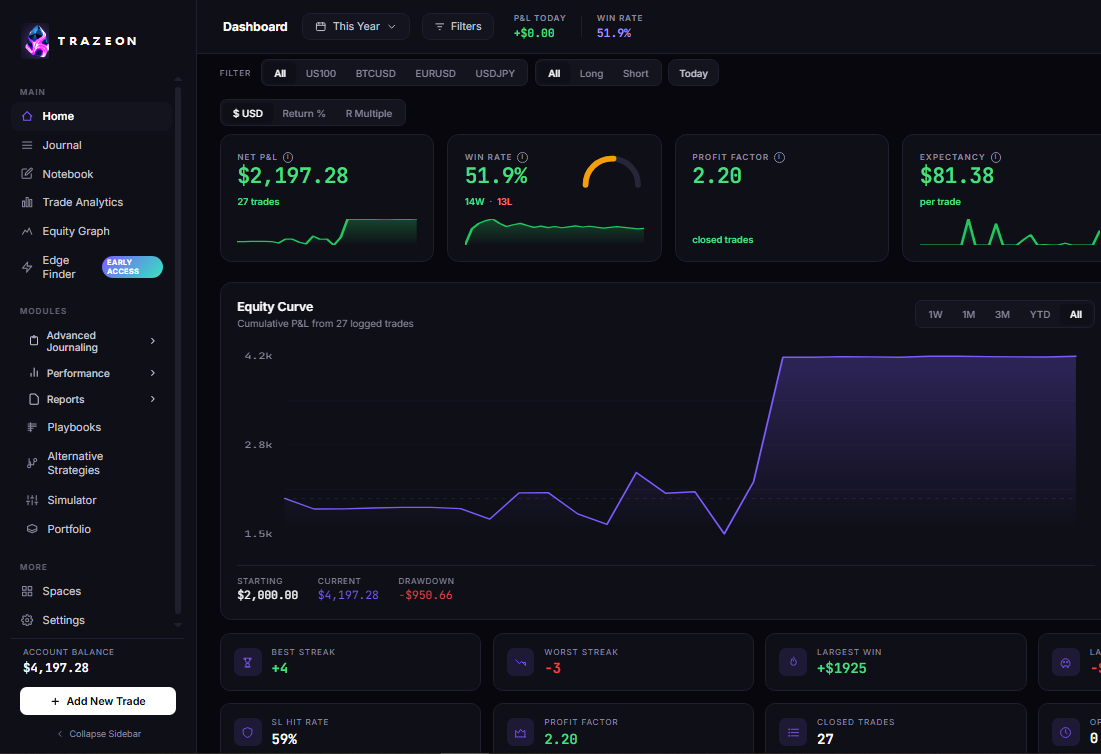
18 deep-dive analytics charts. Every angle of your trading, quantified.
03
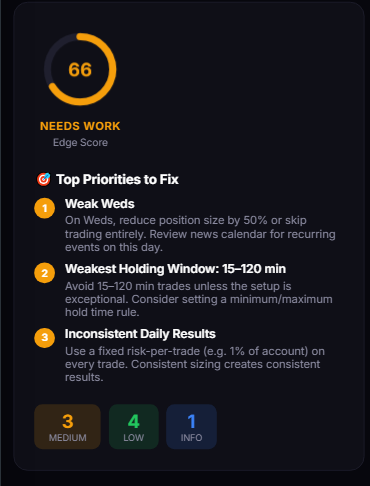
Trazeon scans your entire trade history and surfaces exactly what's hurting your account — ranked by impact, with specific action steps.
"Your data already contains the answer. Trazeon just makes it visible."
04
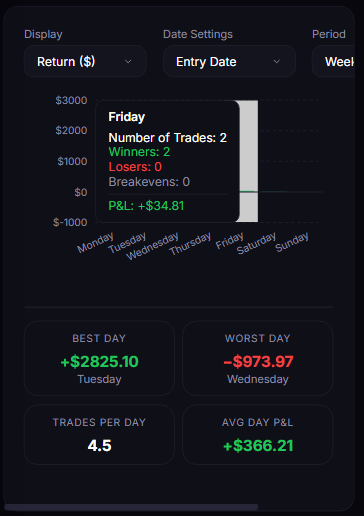
Slice your trade data any way you want. Group by direction, setup, timeframe, or any combination — and see every metric for each group.
05
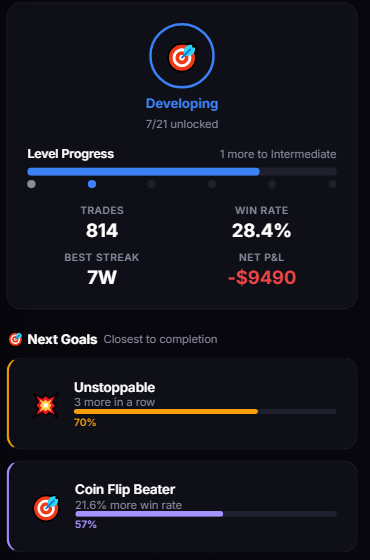
Nine purpose-built tools that cover every part of the trading process — from planning to review to progression.
Most traders are live in under 15 minutes.
Import your MT5 or broker CSV in one click, or log manually in 30 seconds. Every trade tagged and structured from the start.
Trazeon analyzes every trade across sessions, days, setups, and emotions. You see the pattern your gut could never find.
Follow your proven edge. Stick to your rules. Watch your equity curve become the shape of a profitable trader.
I cut Fridays entirely after Trazeon showed me a −42% edge on that day. Monthly P&L jumped 31% within six weeks. It's the kind of clarity I spent four years trying to find in spreadsheets.
My first 45 minutes on the Indian session are 2.4× more profitable than the rest of my day. I never would have found that in Excel. Trazeon showed it in my first session.
The AI caught that I was sizing up after losses — completely backwards psychology. Fixed that one behavior and my drawdowns halved within three weeks.
The Edge Finder showed my best day and my worst day with actual dollar amounts. That one screen changed how I allocate my risk permanently.
SIMPLE PRICING
One plan. Every feature. No tiers. No upsells.
PRO PLAN
The edge you've been trading without
Join 2,400+ traders who found their edge with Trazeon
You just can't see it yet.
GET STARTED →Your data has the answer. You just haven't looked at it the right way yet.